To help shape their community coverage and ensure they were being equitable and accessible to everyone in their coverage areas, The Bloomfield Info Project needed a way to quickly and accurately access demographic information about different parts of their community.
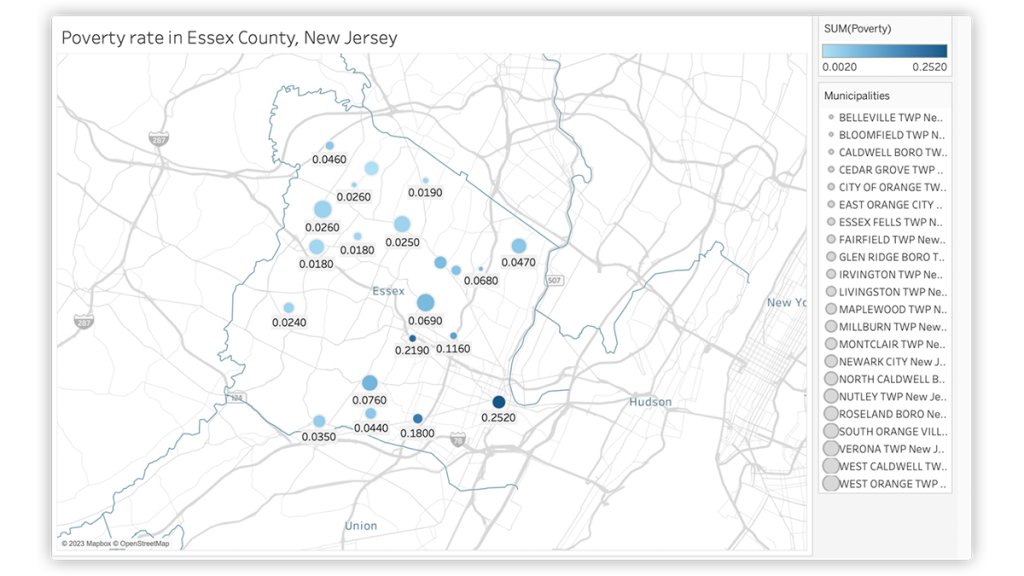
We helped them build a set of interactive maps that provide specific information about the rates of poverty, education, median income and transportation times. We needed maps that could support multiple layers — with enough detail to differentiate counties, neighborhoods, and even down to the street level. We chose to go with Tableau because it met the needs and criteria for the project.


Comments
No comments on this item Please log in to comment by clicking here